Note
This page is generated from the Jupyter notebook
notebooks/03_psf_focus_modes.ipynb in the
repository. You can download it and run it interactively.
PSF focus modes: Airy vs defocus
The WCC observes in focus or deliberately defocused (+1 or +2 waves) to spread bright stars over more pixels. This notebook renders the three PSF modes used by wcc_sim, compares their profiles and encircled energy, and shows the effect of pointing jitter.
Requirements: a kernel with wcc_etc and wcc_sim installed. Fully offline: no Gaia query is made.
[1]:
import numpy as np
import matplotlib.pyplot as plt

import wcc_etc
import wcc_sim

from wcc_sim.plotting import use_style, TEAL, RED, AMBER
use_style()

print(f'wcc_sim {wcc_sim.__version__} | wcc_etc {wcc_etc.__version__}')
wcc_sim 0.1.0 | wcc_etc 0.1.0
1. Render the three PSFs
render_oversampled_psf asks wcc_etc for the PSF on a grid oversampled 11× relative to the detector: the in-focus mode is an analytic Airy pattern, the defocused modes come from Zemax Huygens data bundled with wcc_etc. Default stamp sizes are 129 detector px (in focus) and 257 px (defocus, sized to the ~272 px extent of the Huygens data). Jitter blur at the telescope’s default level is included.
[2]:
from wcc_sim.detectors import make_base_simulation
from wcc_sim.psf import DEFAULT_STAMP, render_oversampled_psf
from wcc_sim.render import bin_oversampled

OVER = 11
sim = make_base_simulation('zwo:r')
plate_mas = sim.sensor.get_plate_scale(sim.telescope).to('arcsec/pix').value * 1000

psfs = {}   # focus -> detector-sampled stamp (binned from the fine grid)
for focus in (0, 1, 2):
    fine = render_oversampled_psf(sim, focus, oversample=OVER)
    psfs[focus] = bin_oversampled(fine, OVER)
    print(f'focus={focus}: stamp {DEFAULT_STAMP[focus]} px '
          f'(fine grid {fine.shape[0]}^2), sum = {psfs[focus].sum():.6f}')
print(f'plate scale {plate_mas:.2f} mas/px')
focus=0: stamp 129 px (fine grid 1419^2), sum = 1.000000
/Users/gudmundurstefansson/Dropbox/mypylib/notebooks/GIT/wcc-sim/src/wcc_sim/psf.py:35: RuntimeWarning: divide by zero encountered in matmul
  cx = (psf.sum(axis=0) @ i) / total
/Users/gudmundurstefansson/Dropbox/mypylib/notebooks/GIT/wcc-sim/src/wcc_sim/psf.py:35: RuntimeWarning: overflow encountered in matmul
  cx = (psf.sum(axis=0) @ i) / total
/Users/gudmundurstefansson/Dropbox/mypylib/notebooks/GIT/wcc-sim/src/wcc_sim/psf.py:35: RuntimeWarning: invalid value encountered in matmul
  cx = (psf.sum(axis=0) @ i) / total
/Users/gudmundurstefansson/Dropbox/mypylib/notebooks/GIT/wcc-sim/src/wcc_sim/psf.py:36: RuntimeWarning: divide by zero encountered in matmul
  cy = (psf.sum(axis=1) @ i) / total
/Users/gudmundurstefansson/Dropbox/mypylib/notebooks/GIT/wcc-sim/src/wcc_sim/psf.py:36: RuntimeWarning: overflow encountered in matmul
  cy = (psf.sum(axis=1) @ i) / total
/Users/gudmundurstefansson/Dropbox/mypylib/notebooks/GIT/wcc-sim/src/wcc_sim/psf.py:36: RuntimeWarning: invalid value encountered in matmul
  cy = (psf.sum(axis=1) @ i) / total
focus=1: stamp 257 px (fine grid 2827^2), sum = 1.000000
focus=2: stamp 257 px (fine grid 2827^2), sum = 1.000000
plate scale 16.87 mas/px
[3]:
from wcc_sim.plotting import plot_stamp

fig, axes = plt.subplots(1, 3, figsize=(15, 4.4))
titles = ['in focus (Airy)', '+1 wave defocus', '+2 waves defocus']
for ax, focus, title in zip(axes, (0, 1, 2), titles):
    p = psfs[focus]
    plot_stamp(p, ax=ax, half_width=80, title=f'{title}\npeak pixel fraction {p.max():.2e}')
plt.show()
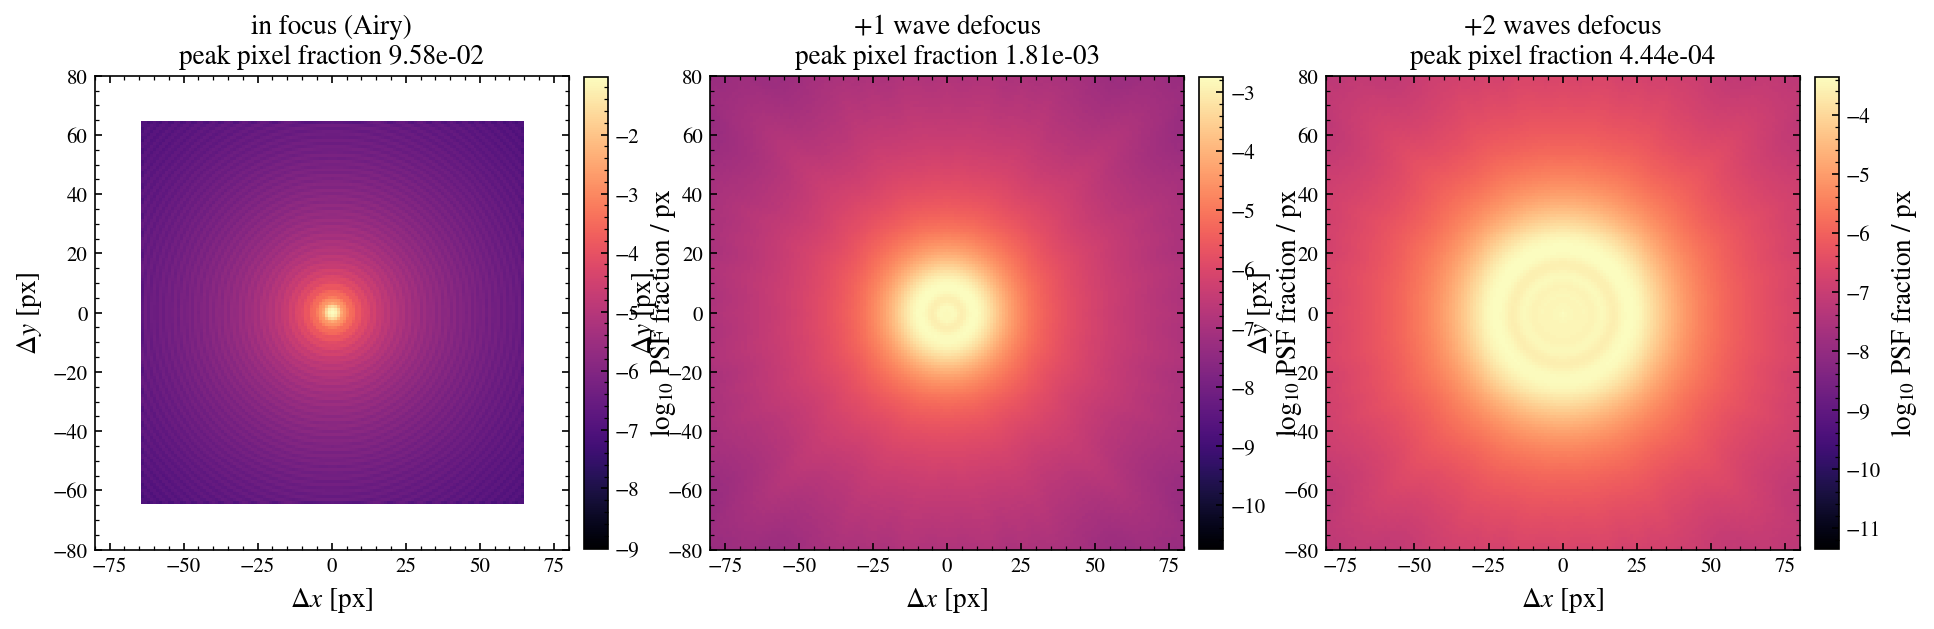
The defocused PSFs are annular: the center is depressed and most of the energy lands in a ring (radius ~29 px for +2 waves). That is why per-star saturation flags use a 32 px window rather than the central pixel alone.
2. Radial profiles and encircled energy
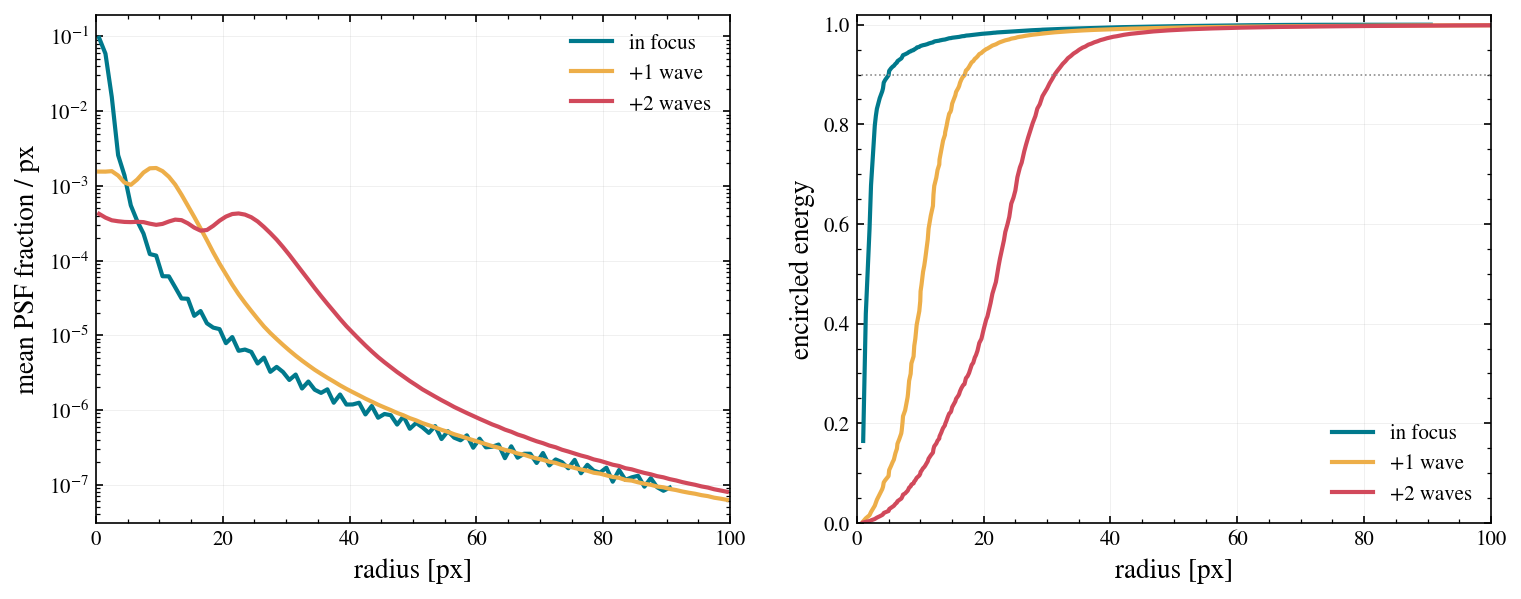
plot_radial_profile() averages the stamp in annuli about its centre and plot_encircled_energy() draws the cumulative fraction inside each radius. Both take ax=, so the three modes share two panels. The EE50 and EE90 radii come from encircled_energy(), the function behind the right-hand panel.
[4]:
from wcc_sim.plotting import encircled_energy, plot_encircled_energy, plot_radial_profile

def ee_radius(r_sorted, ee, level):
    return np.interp(level, ee, r_sorted)

fig, (axL, axR) = plt.subplots(1, 2, figsize=(12, 4.4))
for focus, color, label in [(0, TEAL, 'in focus'), (1, AMBER, '+1 wave'), (2, RED, '+2 waves')]:
    p = psfs[focus]
    half = p.shape[0] // 2
    plot_radial_profile(p, half, half, ax=axL, r_max=100, n_bins=100, color=color, label=label)
    plot_encircled_energy(p, ax=axR, log_x=False, color=color, label=label)
    rs, ee = encircled_energy(p)
    r50, r90 = ee_radius(rs, ee, 0.5), ee_radius(rs, ee, 0.9)
    print(f'focus={focus}: EE50 within {r50:5.1f} px ({r50*plate_mas:6.0f} mas), '
          f'EE90 within {r90:5.1f} px ({r90*plate_mas:6.0f} mas)')
axL.set_ylabel('mean PSF fraction / px'); axL.set_xlim(0, 100)
axR.set_xlim(0, 100); axR.axhline(0.9, color='0.55', lw=0.8, ls=':')
plt.show()
focus=0: EE50 within   1.4 px (    24 mas), EE90 within   5.0 px (    84 mas)
focus=1: EE50 within  10.3 px (   174 mas), EE90 within  17.0 px (   287 mas)
focus=2: EE50 within  22.0 px (   372 mas), EE90 within  31.1 px (   525 mas)
3. Jitter
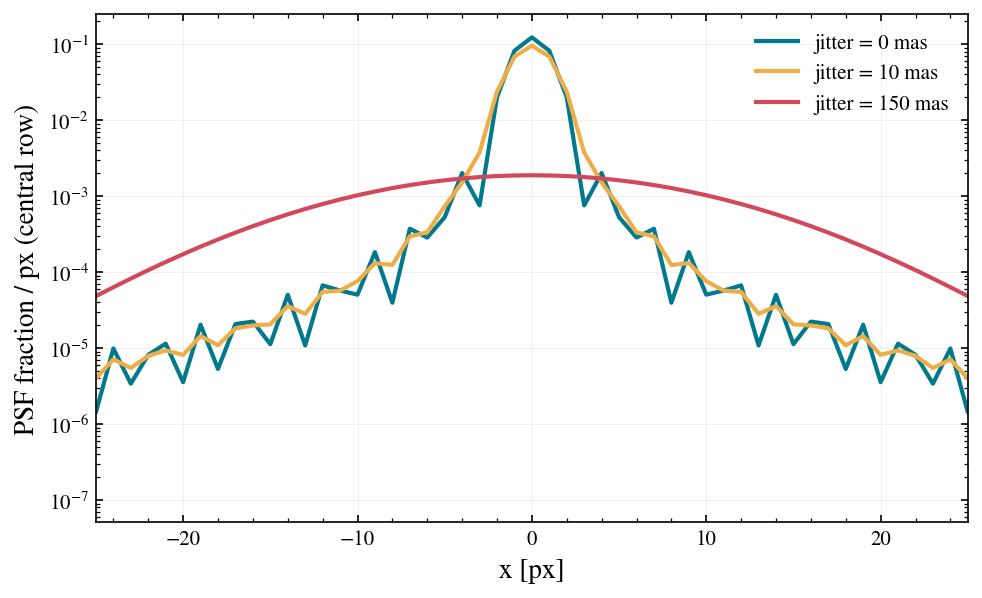
Pointing jitter is a Gaussian blur applied at the fine plate scale. The default comes from the wcc_etc telescope model; jitter_sigma_mas= overrides it per simulation (--jitter on the CLI).
[5]:
default_jitter = float(sim.telescope.jitter_sigma.to('mas').value)
print(f'telescope default jitter: {default_jitter:.1f} mas '
      f'({default_jitter / plate_mas:.2f} px)')

cuts = {}
for jit in (0.0, default_jitter, 150.0):
    fine = render_oversampled_psf(sim, 0, oversample=OVER, jitter_sigma_mas=jit)
    cuts[jit] = bin_oversampled(fine, OVER)

fig, ax = plt.subplots(figsize=(7.5, 4.4))
for (jit, p), color in zip(cuts.items(), (TEAL, AMBER, RED)):
    n = p.shape[0]
    x = np.arange(n) - n // 2
    ax.semilogy(x, p[n // 2], color=color, label=f'jitter = {jit:.0f} mas')
    rs, ee = encircled_energy(p)
    print(f'jitter {jit:6.1f} mas: peak pixel {p.max():.3e}, '
          f'EE50 radius {ee_radius(rs, ee, 0.5):.2f} px')
ax.set_xlim(-25, 25)
ax.set_xlabel('x [px]'); ax.set_ylabel('PSF fraction / px (central row)')
ax.legend()
plt.show()
telescope default jitter: 10.0 mas (0.59 px)
jitter    0.0 mas: peak pixel 1.231e-01, EE50 radius 1.38 px
jitter   10.0 mas: peak pixel 9.578e-02, EE50 radius 1.41 px
jitter  150.0 mas: peak pixel 1.885e-03, EE50 radius 10.82 px
Summary
Three PSF modes:
focus=0(analytic Airy),1and2(Zemax Huygens defocus data), all rendered 11x oversampled and normalised to unit sum.Defocus spreads EE50 from about 1 px to tens of px and makes the PSF annular, which is the basis of the bright-star defocus strategy and of the windowed saturation flag.
Jitter blurs the core and lowers the peak pixel fraction; the telescope default is applied unless overridden.
plot_stamp(),plot_radial_profile()andplot_encircled_energy()inwcc_sim.plottingdraw any centred stamp or image.