Saturation
wcc-etc tracks saturation at the brightest pixel, so you can tell whether
an exposure clips before you commit to it.
The peak pixel
get_peak_pixel() returns the value of the brightest
pixel for a given exposure time. It sums the source, the host, the background,
the dark current and the bias:
sim.get_peak_pixel(60, units="e-")    # electrons
sim.get_peak_pixel(60, units="adu")   # ADU (uses gain + bias)
time may be a scalar or an array.
The saturation flag
is_saturated() compares the peak pixel in electrons
to the sensor’s per-frame ceiling, saturation_e:
sim.is_saturated(60)                   # True / False
sim.is_saturated(np.array([10, 60]))   # array of bools
saturation_e is the smaller of the full well (well_depth) and the
charge at which the ADC clips, (adc_max - bias_level) * gain with
adc_max = 2**bit_depth - 1. Bias uses up ADC headroom without raising the
well. saturation_limit reports which of the two
binds, "well" or "adc". The image mask and the SNR methods test the
same ceiling, so every entry point gives the same answer on the same frame.
On the Sony IMX455 (sony:*) the ADC is 16-bit (adc_max = 65535) and
the full well of about 16.3 ke- binds. On the qCMOS (qcmos:*) the ADC is
12-bit (adc_max = 4095) and the gain mode decides. In the default
high-gain (32x) mode the ADC clips at 4095 / 7.42 = 552 e-, well below the
7500 e- full well. In low-gain (1x) mode the ADC reaches 16,900 e- and the
full well clips first, so pass gain_mode="low" to
from_sensorfilter() for bright targets.
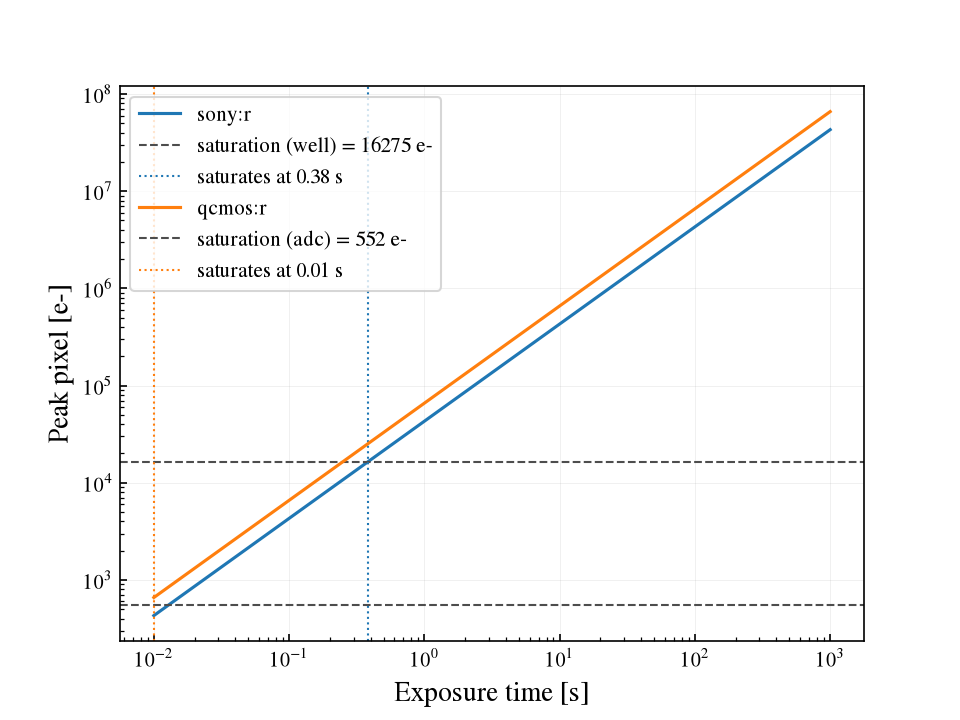
plot_peak_pixel() draws the peak pixel against
exposure time with the ceiling dashed and the onset dotted. For a 12th
magnitude star the two sensors differ by more than an order of magnitude in
how long they can expose:
import numpy as np
import matplotlib.pyplot as plt
import wcc_etc
from wcc_etc import get_scene, Simulation

wcc_etc.set_wcc_style()

bright = get_scene("G5V", mag=12, background="zodi", bandpass="johnson_r")
texp = np.logspace(-2, 3, 200)

fig, ax = plt.subplots()
for label in ("sony:r", "qcmos:r"):
    sim = Simulation.from_sensor_and_scene(label, bright)
    sim.plot_peak_pixel(texp, units="e-", ax=ax, label=label)
Saturation in the image and SNR paths
A simulated image carries a per-pixel mask:
img = imsim.simulate(time=60, add_noise=True)
img.saturation_mask.any()              # did anything saturate?
The mask is evaluated on the returned image_e. With add_noise=True
that is a noisy realization, which can flag pixels the clean prediction does
not. Pass add_noise=False for the same clean frame that
is_saturated() and the SNR methods test.
The image-based SNR methods also report saturation of the rendered per-frame
image through the n_saturated (count) and saturated (bool) keys of
their result, and warn when a pixel clips unless you pass warn=False:
r = sim.get_snr(60)
r["saturated"], r["n_saturated"]
Tip
With multiple reads, saturation is evaluated per frame. A long total exposure split into several reads can avoid clipping that a single long frame would hit, at the cost of extra read noise (see Signal-to-noise and exposure time).